


Bridging Academia and Industry: Power BI and Advanced Excel Workshop for MBA Students
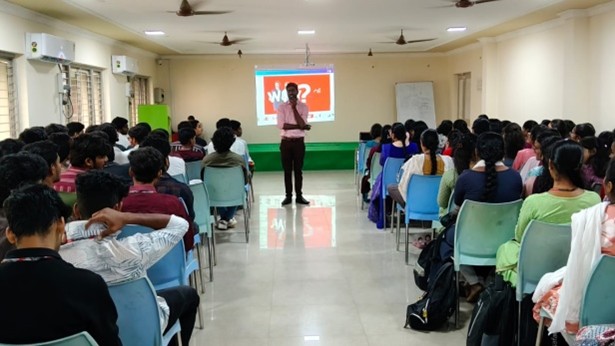
The Department of Management Studies, MVGR College of Engineering (Autonomous), successfully organized a hands-on workshop on Power BI and Advanced Excel for MBA students with the objective of strengthening their analytical, data handling, and business reporting skills. The programme was designed to bridge the gap between academic learning and industry requirements by exposing students to widely used business intelligence and data visualization tools.
About the Programme:
The workshop focused on introducing students to modern data analytics techniques and practical applications of Power BI and Advanced Excel in management decision-making. In today’s data-driven business environment, managers are expected to analyze large volumes of data and present insights in a clear and impactful manner. Keeping this in view, the workshop emphasized practical learning through demonstrations, real-time examples, and interactive discussions.
Resource Persons:
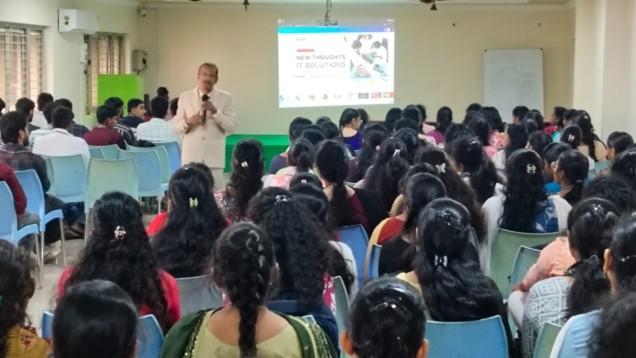
The sessions were handled by experienced resource persons Mr. Sheik Madina and Mr. Anveish, from New Thoughts IT Solution company Visakhapatnam. Who possess strong industry exposure in data analytics and business intelligence tools.
Key highlights of the resource persons's contribution include:
- Demonstration of real-time business dashboards using Power BI
- Explanation of data cleaning, transformation, and modeling techniques
- Practical use of Advanced Excel functions such as VLOOKUP/XLOOKUP, Pivot Tables, Power Query, and data visualization tools
- Sharing of industry-oriented examples to help students understand how analytics supports managerial decision-making
- Career guidance on emerging roles in analytics, finance, marketing, and operations
Objectives of the Workshop:
The primary objectives of the workshop were:
- To provide practical exposure to Power BI and Advanced Excel tools
- To enhance students’ analytical and data interpretation skills
- To familiarize students with industry-relevant reporting and visualization techniques
- To improve employability by aligning student skills with current market demands
- To guide students on career planning and professional certifications in analytics
Programme Content and Learning Outcomes
During the workshop, students gained hands-on experience and conceptual clarity in the following areas:
- Understanding the role of data analytics in business and management
- Creating interactive dashboards and reports using Power BI
- Applying Advanced Excel functions for data analysis and decision support
- Interpreting data insights for strategic and operational decisions
- Developing problem-solving and analytical thinking abilities
Outcomes of the Programme
At the end of the workshop, the participants were able to:
- Understand the practical application of Power BI and Advanced Excel in business scenarios
- Analyze and visualize data effectively for managerial reporting
- Build confidence in using analytical tools for academic projects and internships
- Identify skill gaps and areas for improvement for analytics-oriented careers
- Gain awareness about professional certifications that enhance career prospects
Participation and Response
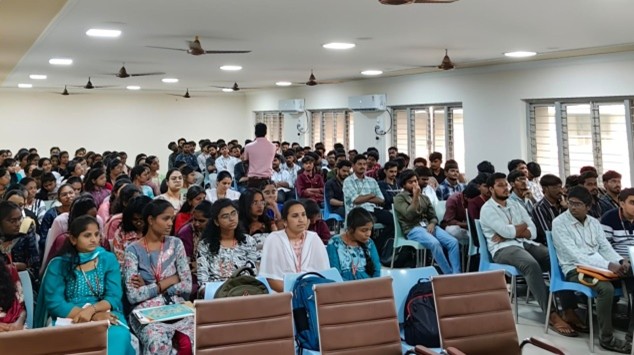
A total of 150 MBA students actively participated in the programme. The session witnessed enthusiastic involvement from students, with active interaction, queries, and discussions throughout the workshop. The practical demonstrations and industry-oriented approach helped students relate theoretical concepts to real-world business applications.
Feedback and Overall Impact
The feedback received from the participants was highly positive. Students appreciated the clarity of explanation, practical orientation, and career guidance provided by the resource persons. Many students expressed that the workshop helped them understand the importance of analytics skills in management education and motivated them to further explore advanced tools and certifications.